Teaching FORTRAN new tricks
 Jim Hall
I learned the FORTRAN programming language in the early 1990s when I was an undergraduate physics student. Back then, many physics students and physicists wrote FORTRAN programs to analyze lab data. FORTRAN made it easy because the language was designed to support mathematics and numerical simulation; the name “FORTRAN” stands for formula translation.
FORTRAN has changed a lot over the years, although it wasn’t until 1990 with “Fortran 90” that the language looked considerably different. The version I learned was “FORTRAN 77,” which was standardized in 1977. This version of the language still retained its punched card roots, with strict column rules. But FORTRAN 77 was very useful for writing programs to analyze lab data or perform numerical simulations; not every lab could be analyzed with a spreadsheet.
While I wrote a lot of FORTRAN programs in my undergraduate days, I haven’t really done much with it since then. But every once in a while, I like to go back and remind myself what you could do with FORTRAN.
Recently, there’s been some interest in “retro-programming” with old DOS compilers, such as the ones that we include in the FreeDOS Project. I thought I’d get into that challenge, and I decided to write a few new programs using Open Watcom FORTRAN 77, on FreeDOS.
The Mandelbrot Set
One thing that FORTRAN makes easy is working with complex numbers, which is a two-part number that has both a real part and an imaginary part, like 3 + 2i, where 3 is the real part and 2 is the imaginary part (the i means “imaginary”). Complex numbers get used a lot in physics and upper-level mathematics, so it’s probably not a surprise that FORTRAN comes with a COMPLEX data type.
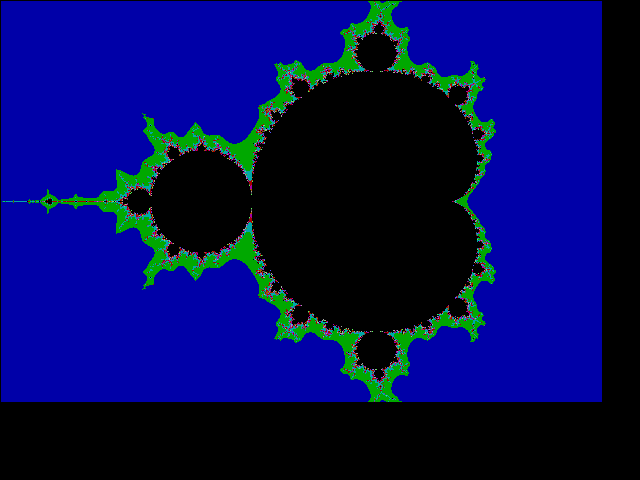
One interesting demonstration of complex numbers is the Mandelbrot Set. This is a kind of “fractal mathematics.” I don’t want to get too deep into the mathematics here, but a simple explanation of the Mandelbrot Set is that it represents a “map” of the equation z = z2 + c, where both z and c are complex numbers. Each “point” or “pixel” in the Mandelbrot Set image shows a different value of c, where the real part of the complex number is on the x axis, and the imaginary part is on the y axis. If you calculate a value of z, you can run the calculation again and again to see what happens. If the value of z “settles down,” then you make a black dot or pixel in the image. If the value of z gets too big, then you make a colored pixel.
That means drawing the Mandelbrot Set is really just a matter of working through all the values of c that you want to show, calculating z = z2 + c over and over to see what happens, and painting a pixel on the screen for that c value. Then you move on to the next value of c and do it again.
For example, this sample program calculates the Mandelbrot Set, although it doesn’t print anything so you can’t see it. We can add that in the next step:
      PARAMETER(STEP=.005,LIMIT=100)
      REAL DIST
      REAL R,I
      COMPLEX Z,C
      INTEGER X,Y
      INTEGER COUNT

      Y=0
      DO 100 I=1.0,-1.0,-STEP
      Y=Y+1

      X=0
      DO 100 R=-2.0,1.0,STEP
      X=X+1

      C=CMPLX(R,I)
      Z=CMPLX(0.0,0.0)
      COUNT=0

10    Z=Z**2+C

      DIST=REAL(Z)**2 + IMAG(Z)**2
      COUNT=COUNT+1
      IF ((DIST.LT.4.0).AND.(COUNT.LT.LIMIT)) GOTO 10

100   CONTINUE

      END
You can see several features of the FORTRAN language here, such as how the DO loop iterates over a set of values. This also starts with REAL numbers for the x and y axes, and converts these to COMPLEX values using the CMPLX function.
This program only calculates numbers, but doesn’t do anything with the results. To do that, we need a way to draw pixels on the screen to represent if the z = z2 + c calculation stays within a range, or if the value grows too big.
Graphics in FORTRAN
The FORTRAN programming language doesn’t have any native support for graphics. It’s an old language that was created long before video terminals. But different FORTRAN compilers might provide some extensions or libraries to create graphics from a FORTRAN program, and that’s just what Open Watcom did.
Using the Open Watcom FORTRAN 77 graphics library requires including two statements at the start of a program that needs to draw graphics:
      INCLUDE 'GRAPHAPI.FI'
      INCLUDE 'GRAPH.FI'
I should emphasize that these libraries are not standard FORTRAN, but an extension to the language provided by the Open Watcom FORTRAN 77 compiler. Compiler-specific extensions are not uncommon, and were actually very common in the 1980s and 1990s to support specific features like graphics on DOS, so it’s not surprising that Open Watcom provides a graphics library on their DOS version of the FORTRAN 77 compiler.
The Open Watcom graphics extensions all use an underscore in front of the routine name. The underscore is actually not part of the FORTRAN 77 character set, but Open Watcom used it to denote their extended libraries. For example, to set the graphics mode, you call the _SETVIDEOMODE routine with the video mode to use (like _TEXTC80 to use color text or _VRES16COLOR to use VGA graphics).
After entering graphics mode, you can put individual pixels on the screen using the _SETPIXEL routine, and change the pixel color using the _SETCOLOR routine. Open Watcom supports other routines to do other things in graphics mode, like drawing rectangles, ellipses, and lines, but drawing pixels is all we need to generate the Mandelbrot Set in a FORTRAN program.
Let’s update the FORTRAN program to not just calculate the Mandelbrot Set, but to draw a pixel on the screen for each value of c. If the z = z2 + c calculation “settles down” (stays within a certain absolute value) then we’ll draw a black pixel for that value of c, where R is the x coordinate and I is the y coordinate. If the calculation instead grows too big, we’ll draw a colored pixel on the screen. We can also do a little math to show a different color to indicate how quickly this value grew out of control: blue for “very fast” and other colors for “not as quickly.”
The full program now looks like this:
      INCLUDE 'GRAPHAPI.FI'
      INCLUDE 'GRAPH.FI'

      PARAMETER(STEP=.005,LIMIT=100)
      REAL DIST
      REAL R,I
      COMPLEX Z,C
      INTEGER X,Y
      INTEGER COUNT

      CALL _SETVIDEOMODE(_VRES16COLOR)

      Y=0
      DO 100 I=1.0,-1.0,-STEP
      Y=Y+1

      X=0
      DO 100 R=-2.0,1.0,STEP
      X=X+1

      C=CMPLX(R,I)
      Z=CMPLX(0.0,0.0)
      COUNT=0

10    Z=Z**2+C

      DIST=REAL(Z)**2 + IMAG(Z)**2
      COUNT=COUNT+1
      IF ((DIST.LT.4.0).AND.(COUNT.LT.LIMIT)) GOTO 10

      CALL _SETCOLOR(1 + COUNT/10)
      IF (COUNT.EQ.100) CALL _SETCOLOR(_BLACK)
      CALL _SETPIXEL(X,Y)
100   CONTINUE

      PAUSE
      CALL _SETVIDEOMODE(_DEFAULTMODE)

      PRINT 900, X,Y
900   FORMAT(I3,1HX,I3)
      END
Drawing the Mandelbrot Set
Save this as a new source file called mand.f on a FreeDOS system, then compile it with the Open Watcom FORTRAN 77 compiler, using the wfl command:
> WFL mand.fAfter a moment, you will have a program called mand.exe that you can run. This generates an image that’s about 600 pixels wide and about 400 pixels tall, on a 640×480 resolution VGA screen.