Navigating the ‘top’ Command in Linux
When checking out Linux systems (or even troubleshooting computers running other operating systems), I frequently use the top command to check out the system’s RAM and CPU utilization. It provides me with information to assess the computer’s overall health. I learned about the top command early in my Linux journey and have relied on it to give me a quick overview of what is happening on servers or other Linux systems, including Raspberry Pi. According to its man page, the top program provides a dynamic real-time view of a running system. It can display system summary information and a list of processes or threads currently managed by the Linux kernel.
I often need A quick overview to determine what is going on with the system in question. But there is so much more to the top command than meets the eye. Specific features of your top command may vary depending on whose version (procps-ng, Busybox, BSD) you run, so consult the man page for details.
To launch top, type it into your terminal:
$ top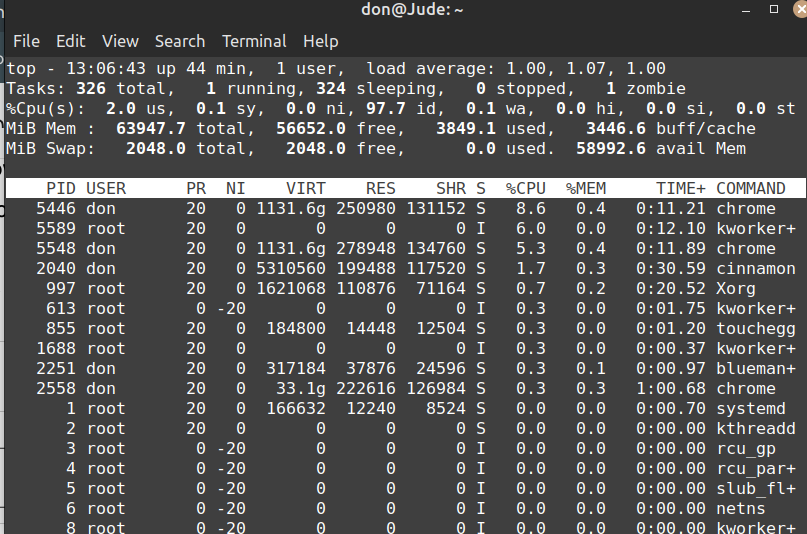
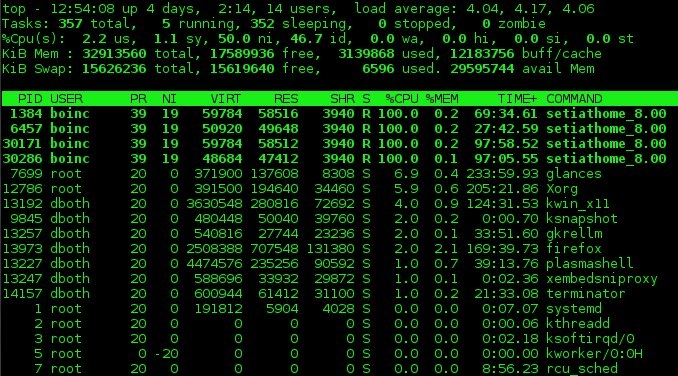
Running processes are displayed below the table heading on the top screen, and system statistics are shown above it.
Press the Z key to change the color of the output. I find this makes the output a little easier on the eyes. Press the 1 key to see a graphical representation of each CPU core on the system. Press 1 repeatedly to assess core statistics for your CPU cores.
You can display memory usage graphically by invoking the top command and then pressing the m key.
Useful top options
If you’re looking only for the processes started by a specific user, you can get that information with the -u option:
$ top -u 'username'To get a list of idle processes on your system, use the -i option:
$ top -iYou can set the update interval to an arbitrary value in seconds. The default value is three seconds. Change it to five like this:
$ top -d 5You can also run top on a timer. For instance, the following command sets the number of iterations to two and then exits:
$ top -n 2Locate a process with top
Press Shift+L to locate a process by name. This creates a prompt just above the bold table header line. Type in the name of the process you’re looking for and then press Enter or Return to see the instances of that process highlighted in the newly sorted process list.
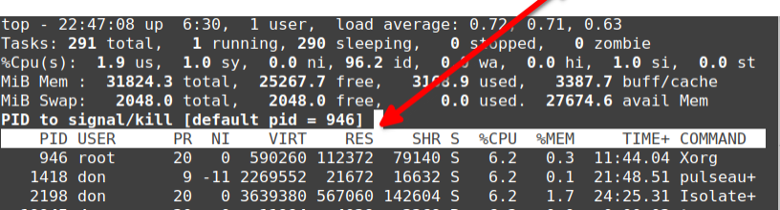
Stopping a process with top
You can stop or “kill” a running process with, too. First, find the process you want to stop using either Shift+L or pgrep. Next, press K and enter the process ID you want to stop. The default value is whatever is at the top of the list, so be sure to enter the PID you want to stop before pressing Enter, or you may stop a process you didn’t intend to.
Top top
There are many iterations of the top command, including htop, atop, btop, and ttop. There are specialized top commands, too, like powertop for power usage and ntop for networks. What’s your favorite top?
More Stories
Extend the life of your Linux SSD drive with fstrim
SSDs have benefits like silent and cooler operation and a faster interface spec, compared to their elder spinning ancestors. Of course, new technology brings with it new methods of maintenance and management. SSDs have a feature to reclaim unused blocks on the device.
NetworkManager on Linux: #3 — How I migrated to NetworkManager Connection Files for configuration
Interface configuration files may not be supported in Fedora much longer, but migrating to NetworkManager is easier than you might think.
An introduction to GRUB2 configuration for your Linux machine
Learn how the GRUB boot loader works to prepare your system and launch your operating system kernel.
NetworkManager on Linux: #2 — A sysadmin’s guide to network interface configuration files
Simplify the complex world of interface configuration files with this handy tutorial.
A Linux networking guide to CIDR notation and configuration
One of the key concepts in network routing that any Linux professional should be familiar with is network notation. CIDR stands for Classless-Inter Domain Routing; it defines a notation methodology for network addressing that is used to specify the network portion of an IP address.
NetworkManager on Linux: #1 — Getting Started
Most current Linux distributions use NetworkManager for creating and managing network connections. Learn what NetworkManager is and how to use it to view network connections and devices for Linux hosts.