Last Updated on January 2, 2026 by David Both
As a SysAdmin, I need to manage the filesystems on the hosts in my home lab. There’s usually little to do, but when there is it can be interesting. For the most part it’s just a bit of monitoring to ensure that none of the filesystems are getting close to that 80% full mark at which performance tends to suffer. When that happens I need to expand the logical volume and the filesystem on it.
Disk space
I currently use Logical Volume Management (LVM) with EXT4 filesystems on each volume. This has been my standard setup since LVM became available on Fedora. It’s really made managing disk space easier because space can be added on-the-fly while the system is running with no interruption to the tasks being performed by the system.
But that’s a different part of the story. First we need to determine which filesystems are filling up. This article is about that.
The df command
The ancient and venerable df command provides a simple but good overview of the structure and usage of the storage space on a Linux system. Figure 1 shows the results of this command on my primary workstation, which has a complex storage setup.
# df
Filesystem                     1K-blocks      Used Available Use% Mounted on
/dev/mapper/vg01-root           10218772   1595728   8082372  17% /
/dev/mapper/vg01-usr            61611872  34385092  24148564  59% /usr
devtmpfs                        32699832        44  32699788   1% /dev
tmpfs                           32745276        12  32745264   1% /dev/shm
efivarfs                             128       110        14  90% /sys/firmware/efi/efivars
tmpfs                           13098112      2492  13095620   1% /run
tmpfs                               1024         0      1024   0% /run/credentials/systemd-journald.service
/dev/nvme1n1p2                   5074592    659084   4136980  14% /boot
/dev/nvme1n1p1                   5232640     19776   5212864   1% /boot/efi
/dev/mapper/vg02-home          256920004  60070852 183725568  25% /home
/dev/mapper/vg01-tmp            15178696   2271596  12130028  16% /tmp
/dev/mapper/vg01-var            51290592   3875932  44776836   8% /var
/dev/mapper/vg03-Virtual       960306656 584697028 333980640  64% /Virtual
/dev/mapper/vg01-ansible        15375304    220484  14352004   2% /home/dboth/development/ansible
/dev/mapper/vg04-VMArchives    824572824 281697720 500915680  36% /VMArchives
/dev/mapper/vg04-stuff         256920004 114328504 129467916  47% /stuff
tmpfs                            6549052       208   6548844   1% /run/user/1000
dboth@bunkerhill:/var/Pictures 479537840  18701076 436404124   5% /home/dboth/Pictures
tmpfs                            6549052       208   6548844   1% /run/user/0
Figure 1: The plain df command provides insight into the storage on Linux systems.
The left-most column shows the filesystem name or its device special file in the /dev directory. This command also displays the total space on the filesystem, how much is used, and how much is still available. The last column is the mountpoint for the filesystem.
You can see in Figure 1 the list of mounted filesystems, some of which are temporary filesystems that exist only in RAM. You can also see the LVM structure which shows four volume groups and the logical volumes extant on each. You can also see that the /boot and /boot/efi filesystems are not part of the LVM structure because they need to be on a standard Linux partition to be able to boot.
The df command displays usage data in 1K blocks, but you can use the -h option which displays the data in human readable form as in Figure 2. The data is shown in GB or MB as appropFigure 5: The df command showing only the EXT4 filesystems.riate for the order of magnitude.
# df -h
Filesystem                      Size  Used Avail Use% Mounted on
/dev/mapper/vg01-root           9.8G  1.6G  7.8G  17% /
/dev/mapper/vg01-usr             59G   33G   23G  59% /usr
devtmpfs                         32G   44K   32G   1% /dev
tmpfs                            32G   12K   32G   1% /dev/shm
efivarfs                        128K  110K   14K  90% /sys/firmware/efi/efivars
tmpfs                            13G  2.5M   13G   1% /run
tmpfs                           1.0M     0  1.0M   0% /run/credentials/systemd-journald.service
/dev/nvme1n1p2                  4.9G  644M  4.0G  14% /boot
/dev/nvme1n1p1                  5.0G   20M  5.0G   1% /boot/efi
/dev/mapper/vg02-home           246G   58G  176G  25% /home
/dev/mapper/vg01-tmp             15G  2.2G   12G  16% /tmp
/dev/mapper/vg01-var             49G  3.7G   43G   8% /var
/dev/mapper/vg03-Virtual        916G  558G  319G  64% /Virtual
/dev/mapper/vg01-ansible         15G  216M   14G   2% /home/dboth/development/ansible
/dev/mapper/vg04-VMArchives     787G  269G  478G  36% /VMArchives
/dev/mapper/vg04-stuff          246G  110G  124G  47% /stuff
tmpfs                           6.3G  208K  6.3G   1% /run/user/1000
dboth@bunkerhill:/var/Pictures  458G   18G  417G   5% /home/dboth/Pictures
tmpfs                           6.3G  208K  6.3G   1% /run/user/0
Figure 2: The df command showing data in human readable form.
The most important option I use is -i, which displays the total number of inodes and those used and available, as in Figure 3.
# df -ih
Filesystem                     Inodes IUsed IFree IUse% Mounted on
/dev/mapper/vg01-root            640K   21K  620K    4% /
/dev/mapper/vg01-usr             3.8M  1.1M  2.7M   30% /usr
devtmpfs                         7.8M  1.2K  7.8M    1% /dev
tmpfs                            7.9M     5  7.9M    1% /dev/shm
efivarfs                            0     0     0     - /sys/firmware/efi/efivars
tmpfs                            800K  2.0K  799K    1% /run
tmpfs                            1.0K     2  1022    1% /run/credentials/systemd-journald.service
/dev/nvme1n1p2                   320K   124  320K    1% /boot
/dev/nvme1n1p1                      0     0     0     - /boot/efi
/dev/mapper/vg02-home             16M  358K   16M    3% /home
/dev/mapper/vg01-tmp             960K    80  960K    1% /tmp
/dev/mapper/vg01-var             3.2M  7.5K  3.2M    1% /var
/dev/mapper/vg03-Virtual          59M   230   59M    1% /Virtual
/dev/mapper/vg01-ansible         960K   41K  920K    5% /home/dboth/development/ansible
/dev/mapper/vg04-VMArchives       50M   200   50M    1% /VMArchives
/dev/mapper/vg04-stuff            16M   906   16M    1% /stuff
tmpfs                            1.6M   180  1.6M    1% /run/user/1000
dboth@bunkerhill:/var/Pictures    30M  6.8K   30M    1% /home/dboth/Pictures
tmpfs                            1.6M   140  1.6M    1% /run/user/0
Figure 3: The df command showing the number of inodes and their usage.
Inodes are important because they store much of the metadata for each file including the locations of its data on the storage device. Every file in an EXT filesystem has at least one inode and large files can have several. If all the inodes are in use, say for a large number of small files, no new files can be created even if there are plenty of free data blocks on the filesystem. Fortunately the default number of inodes allocated when the filesystem is created is excellent for most use cases. But not all.
Figure 3 shows that only a small percentage of inodes are used on my workstation.
The df command has other interesting options such as – – total, which prints totals at the bottom of the listing, and -T which displays the file type for each filesystem. Figure 4 shows both of these options.
# df -hT --total
Filesystem                     Type        Size  Used Avail Use% Mounted on
/dev/mapper/vg01-root          ext4        9.8G  1.6G  7.8G  17% /
/dev/mapper/vg01-usr           ext4         59G   33G   23G  59% /usr
devtmpfs                       devtmpfs     32G   44K   32G   1% /dev
tmpfs                          tmpfs        32G   12K   32G   1% /dev/shm
efivarfs                       efivarfs    128K  110K   14K  90% /sys/firmware/efi/efivars
tmpfs                          tmpfs        13G  2.5M   13G   1% /run
tmpfs                          tmpfs       1.0M     0  1.0M   0% /run/credentials/systemd-journald.service
/dev/nvme1n1p2                 ext4        4.9G  644M  4.0G  14% /boot
/dev/nvme1n1p1                 vfat        5.0G   20M  5.0G   1% /boot/efi
/dev/mapper/vg02-home          ext4        246G   58G  176G  25% /home
/dev/mapper/vg01-tmp           ext4         15G  2.2G   12G  16% /tmp
/dev/mapper/vg01-var           ext4         49G  3.7G   43G   8% /var
/dev/mapper/vg03-Virtual       ext4        916G  558G  319G  64% /Virtual
/dev/mapper/vg01-ansible       ext4         15G  216M   14G   2% /home/dboth/development/ansible
/dev/mapper/vg04-VMArchives    ext4        787G  269G  478G  36% /VMArchives
/dev/mapper/vg04-stuff         ext4        246G  110G  124G  47% /stuff
tmpfs                          tmpfs       6.3G  208K  6.3G   1% /run/user/1000
dboth@bunkerhill:/var/Pictures fuse.sshfs  458G   18G  417G   5% /home/dboth/Pictures
tmpfs                          tmpfs       6.3G  208K  6.3G   1% /run/user/0
total                          -           2.9T  1.1T  1.7T  39% -
Figure 4: The df command can be used to show the filesystem type along with totals.
We can also use the -t option to display only the filesystems of a specific type such as EXT4. Most of the time this makes more sense than showing the virtual (temporary) filesystems and even the vfat and EFI filesystems. Figure 5 illustrates that this gives a more accurate picture of the usable storage space on the system.
# df -ht ext4 --total
Filesystem                   Size  Used Avail Use% Mounted on
/dev/mapper/vg01-root        9.8G  1.6G  7.8G  17% /
/dev/mapper/vg01-usr          59G   33G   23G  59% /usr
/dev/nvme1n1p2               4.9G  644M  4.0G  14% /boot
/dev/mapper/vg02-home        246G   58G  176G  25% /home
/dev/mapper/vg01-tmp          15G  2.2G   12G  16% /tmp
/dev/mapper/vg01-var          49G  3.7G   43G   8% /var
/dev/mapper/vg03-Virtual     916G  558G  319G  64% /Virtual
/dev/mapper/vg01-ansible      15G  216M   14G   2% /home/dboth/development/ansible
/dev/mapper/vg04-VMArchives  787G  269G  478G  36% /VMArchives
/dev/mapper/vg04-stuff       246G  110G  124G  47% /stuff
total                        2.3T  1.1T  1.2T  47% -
Figure 5: The df command showing only the EXT4 filesystems.
Note that the df command shows only the filesystems that are mounted. Unmounted filesystems are ignored.
The dfc command
The relatively new dfc command shows much the same data as the df command, but also displays a simple graph to visualize the free vs used space on each filesystem. Figure 6 shows that it also allows you to use -t to specify the filesystem type to display, -T to display the filesystem type, and -s to display usage sums on the bottom line.
# dfc -sTt ext4
FILESYSTEM               TYPE       (=) USED      FREE (-)  %USED AVAILABLE  TOTAL MOUNTED ON
/dev/mapper/vg01-root    ext4       [=====---------------]  20.9%      7.7G   9.7G /
/dev/mapper/vg01-usr     ext4       [=============-------]  61.0%     22.9G  58.8G /usr
/dev/nvme1n1p2           ext4       [====----------------]  18.5%      3.9G   4.8G /boot
/dev/mapper/vg02-home    ext4       [======--------------]  28.5%    175.2G 245.0G /home
/dev/mapper/vg01-tmp     ext4       [=====---------------]  20.1%     11.6G  14.5G /tmp
/dev/mapper/vg01-var     ext4       [===-----------------]  12.7%     42.7G  48.9G /var
/dev/mapper/vg03-Virtual ext4       [==============------]  65.2%    318.5G 915.8G /Virtual
/dev/mapper/vg01-ansible ext4       [==------------------]   6.7%     13.7G  14.7G +oth/development/ansible
+/mapper/vg04-VMArchives ext4       [========------------]  39.3%    477.7G 786.4G /VMArchives
/dev/mapper/vg04-stuff   ext4       [==========----------]  49.6%    123.5G 245.0G /stuff
SUM:                                [=========-----------]  44.1%      1.2T   2.3T
Figure 6: The dfc command displays a graph to help visualize free vs used space.
On a color terminal, the dfc command displays the data in color. Options allow you to sort the output by filesystem type, name, or mount point; show inode information; to export the data in different formats such as JSON, CSV, HTML, text, and tex; to print the mount options for each filesystem; to display only local filesystems. Read the man page for details of these options.
The duf command
The duf command, takes dfc even further with its advanced formatting. The results of the duf command with no options on my primary workstation are shown in Figure 7.
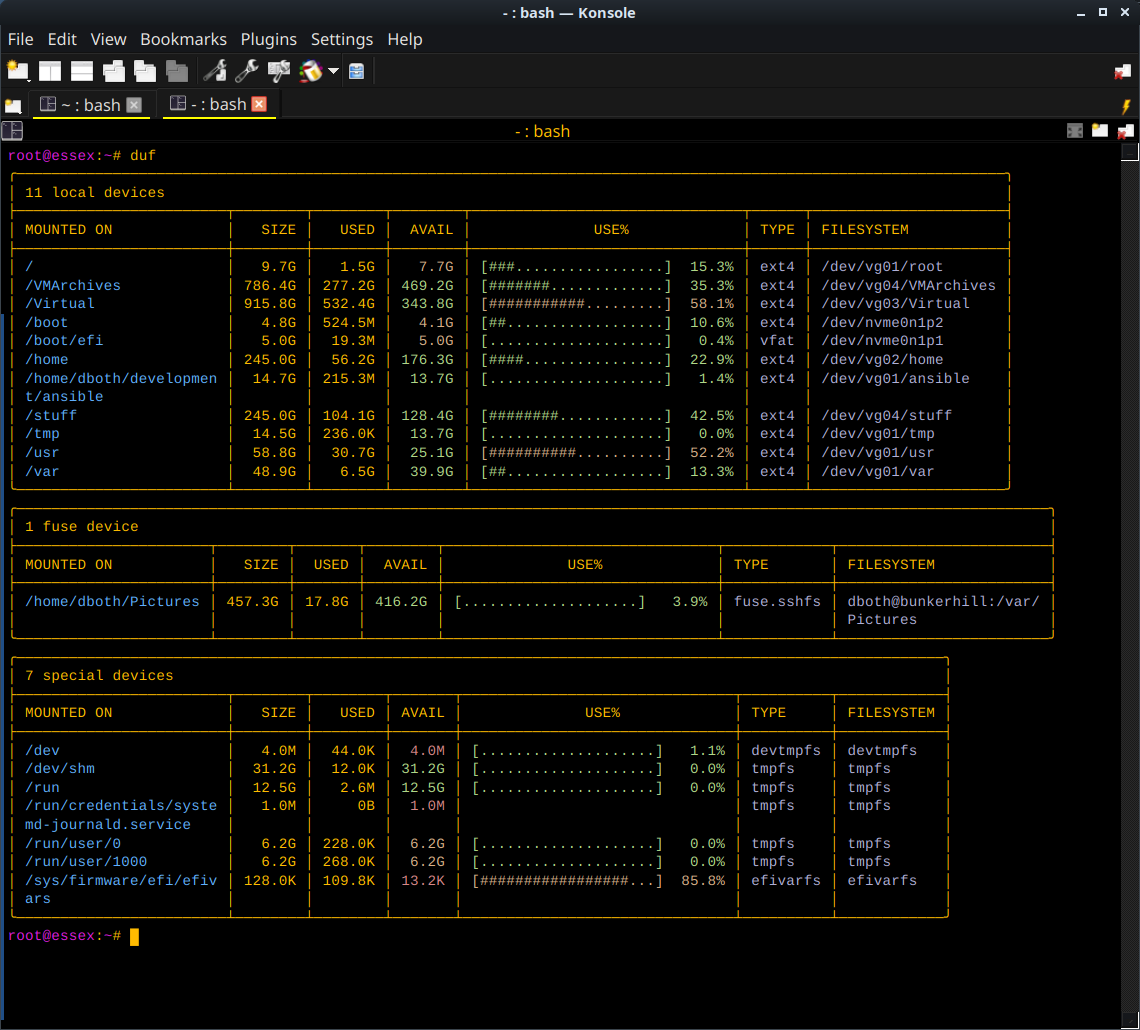
This cool and relatively new command displays storage statistics in tables that separate the storage device types into local, fuse (User space file storage), and special devices. Each type has it’s own characteristics and use cases, so separating them in this manner makes sense.
The local devices are logical volumes and partitions that provide the normal storage locations for our systems whether running or powered off. The fuse devices are usually remote storage. On my system the /home/dboth/Pictures device is an SSHFS (SSH FileSystem) device that is on a remote system, the bunkerhill host in this case.
The special devices are usually virtual filesystems that the host uses for tracking and managing every part of the running system. The common ones I think about are /proc and /sys.
Like the df and dfc commands, the duf command has several options designed to allow you to filter the storage devices and filesystem types, such as EXT4 or VFAT, so that you only see the ones you are interested in. On the opposite extreme, when used with the -all option it shows devices that are normally not displayed.
The lsblk command
I like the lsblk command because it provides much the same information as the df-style commands, and it also displays the hierarchical structure of the filesystems on your computer in a tree format. The other reason I like this tool so much, is that it not only displays mounted filesystems, it also displays the unmounted ones. As you can see in Figure 8, this can help visualization of all the storage on your system no matter its mount state.
# lsblk
NAME                   MAJ:MIN RM   SIZE RO TYPE MOUNTPOINTS
sda                      8:0    0 931.5G  0 disk
└─vg03-Virtual         252:6    0 931.5G  0 lvm  /Virtual
sdb                      8:16   0   2.7T  0 disk
├─vg04-stuff           252:8    0   250G  0 lvm  /stuff
└─vg04-VMArchives      252:9    0   800G  0 lvm  /VMArchives
sdc                      8:32   0   3.6T  0 disk
└─sdc1                   8:33   0   3.6T  0 part
  └─vg_Backups-Backups 252:7    0   3.6T  0 lvm
sdd                      8:48   0   3.6T  0 disk
└─sdd1                   8:49   0   3.6T  0 part
sde                      8:64   0 465.1G  0 disk
└─sde1                   8:65   0 465.1G  0 part
sr0                     11:0    1  1024M  0 rom
sr1                     11:1    1   668M  0 rom
zram0                  251:0    0     8G  0 disk [SWAP]
nvme0n1                259:0    0 476.9G  0 disk
└─vg02-home            252:2    0   250G  0 lvm  /home
nvme1n1                259:1    0 476.9G  0 disk
├─nvme1n1p1            259:2    0     5G  0 part /boot/efi
├─nvme1n1p2            259:3    0     5G  0 part /boot
└─nvme1n1p3            259:4    0 466.9G  0 part
  ├─vg01-root          252:0    0    10G  0 lvm  /
  ├─vg01-usr           252:1    0    60G  0 lvm  /usr
  ├─vg01-var           252:3    0    50G  0 lvm  /var
  ├─vg01-tmp           252:4    0    15G  0 lvm  /tmp
  └─vg01-ansible       252:5    0    15G  0 lvm  /home/dboth/development/ansible
Figure 8: The lsblk command shows both mounted and unmounted filesystems.
This command defaults to display of human readable sizes, the storage device as a whole in addition to the partitions and volumes on it, and the disk type. This is the only tool that shows this level of detail, and it makes the relationships between the devices and the device metastructures clearer than any of the others.
The lsblk command also has numerous options for formatting the content of the displayed data such as ASCII or JSON. Other options allow display of different columns and to provide a simple list in a format similar to the df-like tools. You can also use lsblk -H to list all 71 of the available columns of data. There’s a huge amount of data available with this tool.
Read the man page to get a full picture of the capabilities of this tool.
BtrFS filesystems
So far, I’ve discussed my systems, on which I prefer an LVM and EXT4 filesystem configuration. But BtrFS is different. Although I typically don’t use BtrFS, It’s now the default for Fedora installations. In fact, it’s the only option for all Fedora installation images except the Server Edition, so we should be familiar with how that looks.
I’ll use one of my VMs which uses the default filesystem configuration. It’s much simpler than my workstation, but you’ll see how a BtrFS filesystem looks. Figure 9 illustrates the results of the dfc command.
# dfc -T
FILESYSTEM TYPE     (=) USED      FREE (-)  %USED AVAILABLE  TOTAL MOUNTED ON
/dev/sda3  btrfs    [=-------------------]   3.4%    239.6G 248.0G /
devtmpfs   devtmpfs [--------------------]   0.0%      5.9G   5.9G /dev
tmpfs      tmpfs    [--------------------]   0.0%      6.0G   6.0G /dev/shm
tmpfs      tmpfs    [=-------------------]   0.0%      2.4G   2.4G /run
tmpfs      tmpfs    [--------------------]   0.0%      1.0M   1.0M +ystemd-journald.service
tmpfs      tmpfs    [=-------------------]   0.0%      6.0G   6.0G /tmp
/dev/sda3  btrfs    [=-------------------]   3.4%    239.6G 248.0G /home
/dev/sda2  ext4     [=======-------------]  32.1%      1.3G   1.9G /boot
tmpfs      tmpfs    [=-------------------]   0.0%      1.2G   1.2G /run/user/980
tmpfs      tmpfs    [=-------------------]   0.0%      1.2G   1.2G /run/user/0
Figure 9: Using the dfc command to look at a system with a BtrFS filesystem.
Let’s get rid of the temp filesystems so we can see the EXT4 and BtrFS filesystems more easily. Multiple filesystem types can be listed, separated by commas.
# dfc -Tt ext4,btrfs
FILESYSTEM TYPE     (=) USED      FRlsblkEE (-)  %USED AVAILABLE  TOTAL MOUNTED ON
/dev/sda3  btrfs    [=-------------------]   3.4%    239.6G 248.0G /
/dev/sda3  btrfs    [=-------------------]   3.4%    239.6G 248.0G /home
/dev/sda2  ext4     [=======-------------]  32.1%      1.3G   1.9G /boot
Figure 10: Filtering only EXT4 and BtrFS filesystems.
This makes it easy to see that the BtrFS filesystem is used for both root (/) and /home. Note that both have exactly the same total space as well as that of used and available. That tells us that both are subvolumes of the BtrFS volume on /dev/sda3.
That’s even more clear when we use lsblk in Figure 10. It lists all subvolumes under the same branch of the tree.
# lsblk
NAME   MAJ:MIN RM  SIZE RO TYPE MOUNTPOINTS
sda      8:0    0  250G  0 disk
├─sda1   8:1    0    1M  0 part
├─sda2   8:2    0    2G  0 part /boot
└─sda3   8:3    0  248G  0 part /home
                                /
sr0     11:0    1 1024M  0 rom
zram0  251:0    0    8G  0 disk [SWAP]
Figure 10: The lsblk utility clearly shows that the / and /home directories are subvolumes of the BtrFS filesystem on /dev/sda3.
Parting thoughts
Knowing the way your data storage devices are configured and structured makes troubleshooting easier. The four tools we looked at in this article all provide important information that lets you build a picture of your storage devices.
I prefer lsblk for its use of the tree structure to help visualization. But it doesn’t display disk usage without a bit of work, so I use dfc or duf for that.